We all know how different schools are now compared to a couple of generations ago – but school environments have changed drastically from even just a few years ago.
While the best schools are quick to adjust to changes in technology and to accommodate the ever-changing needs of their students, these schools also recognize that one of their top priorities today is safety – which has also changed significantly in recent years.
A Look at Some Statistics
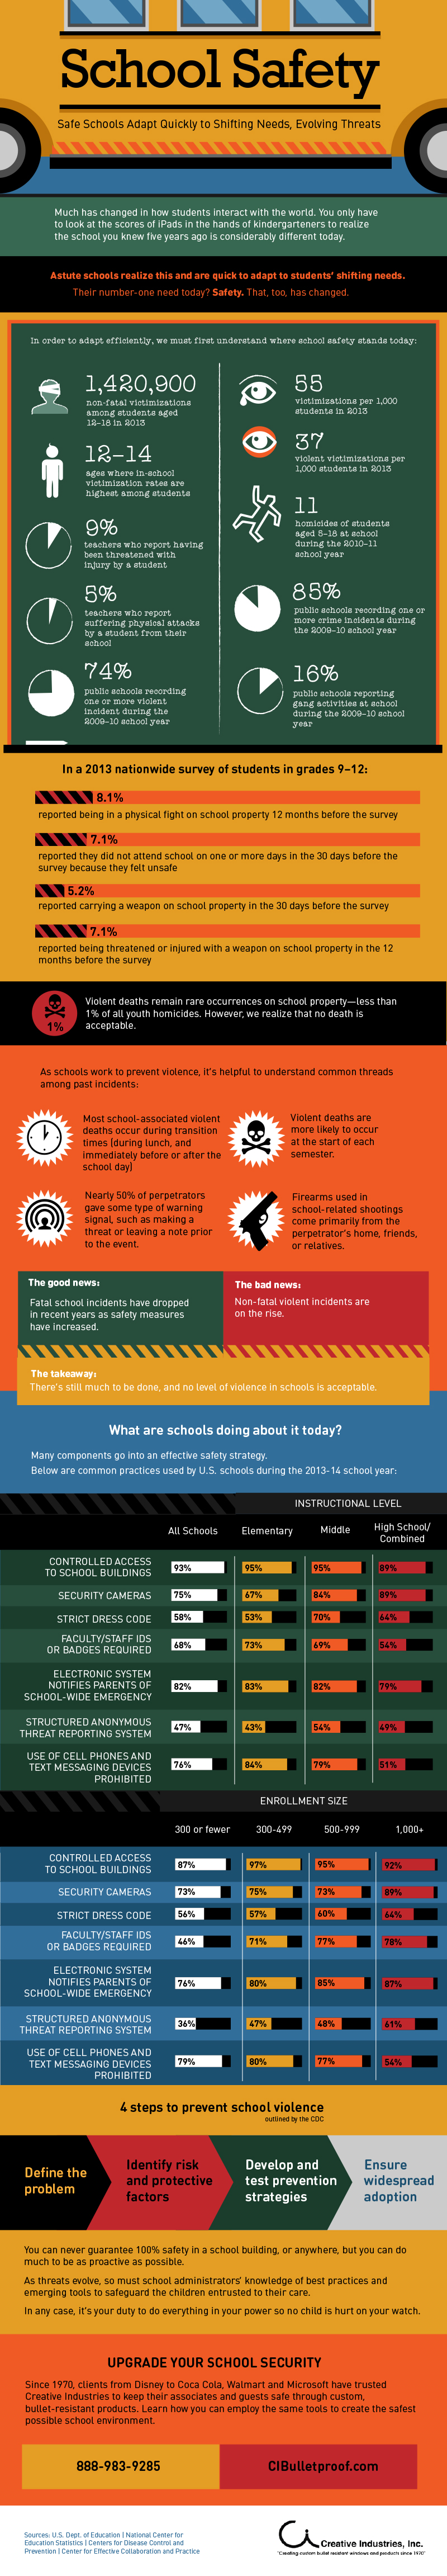
The need for schools to understand and adapt to modern safety requirements is critical. With continuous threats that compromise the safety of our schools, it’s important to take a look at some statistics that highlight the current safety climate in our schools.
- In 2013, there were over 1.4 million non-fatal victimizations among students 12-18 years of age. In-school victimization rates are highest among students between the ages of 12 and 14.
- During the 2009-10 school year, 74% of public schools recorded at least one violent incident; 85% recorded one or more crime incident.
- In a 2013 nationwide survey of high school students (grades 9-12), 7% of students reported that they didn’t attend school on at least one day during the 30 days prior to the survey because they felt unsafe. The same percentage of students reported being threatened or injured with a weapon on school property within the 12 months prior to the survey.
While these statistics are unnerving, the good news is that increased safety measures at schools have resulted in fewer fatal school incidents. However, non-fatal violent incidents are increasing. This tells us that, although significant improvements have been made, there’s still a lot more that needs to be done to rid schools of violence.
Common Threads
When working to increase school safety and prevent violence, understanding some of the common threads among past incidents is helpful for determining the most powerful plan of action:
- Transition times (during lunch and immediately before or after the school day) are when the majority of school-associated deaths occurred.
- Almost half of the perpetrators gave some type of warning before the event took place, such as leaving a note or making a threat.
- Firearms used in school-related shootings came primarily from the perpetrator’s home, relatives, or friends.
What Can Schools Do to Prevent School Violence?
The Centers for Disease Control and Prevention (CDC) outlines the following four steps that school administers should take to prevent school violence and be proactive about protecting the children in their schools:
- Define the problem
- Identify risk and protective factors
- Develop and test prevention strategies
- Ensure widespread adoption
Truly effective safety strategies involve numerous components and, while there isn’t a one-size fits all solution, there are certain common practices used by schools. View our infographic below for a breakdown on the types of security practices used by schools (both by instructional level and by enrollment size) during the 2013-14 school year.